Blog › Teaching Sea-Level Rise with a Model Students Can Turn
Teaching Sea-Level Rise with a Model Students Can Turn
Sea-level rise is hard to teach from numbers. "One metre by 2100" lands differently after a student has flooded a real estuary at +1 m and watched the waterfront disappear block by block. The trick is letting them drive.
The one-click lesson
Pick a coastal region students know — their own county works best — and switch to 3D. The sea-level presets flood the model from its lowest point: +1, +3, +10, +25 and +60 metres, one button each. Dragging the water-level slider reaches any level across the region's full elevation range.
The questions write themselves from there:
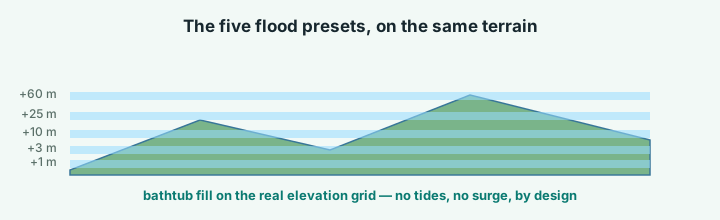
| Preset | What students see | Good follow-up question |
|---|---|---|
| +1 m | Waterfront streets, ports, beaches gone | Who lives here? |
| +3 m | Estuaries back up before open coasts move | Why not "more of the same"? |
| +10 m | Secondary towns, farmland, coastal roads cut | Where do people go? |
| +25 m | Whole districts become islands | Which ridges stay connected? |
| +60 m | Region reshaped, some places gone entirely | Is your region an island or a lifeboat? |
- Which neighbourhood goes first at +1 m? Who lives there?
- Between +3 and +10, what changes — and why is it not just "more of the same"? (River mouths back up before open coasts move.)
- At +60, is your region an island or gone entirely? Which neighbouring region is the lifeboat?
Make the comparison honest
Two settings make cross-region comparisons fair. Set Band scaling to Absolute elevation so the same metre value means the same thing everywhere. And keep the scale bar on exported images — a flooded county at 30 km across reads very differently from one at 3 km.
Exports carry the legend and credits inside the image, so slides and handouts stay self-contained. A 30-second orbit video works well between sections of a lecture.
What to tell students it is
Say it plainly: this is a bathtub visualisation, not a forecast. Water stands at a chosen height above today's sea level; there are no tides, no storm surge, no waves, no land subsidence. At roughly 30 m elevation resolution it shows which land lies below which threshold — genuinely useful for reasoning about exposure — but it cannot say when or how fast. That honesty is the lesson's second half: students learn what a model leaves out, which is the part most flood graphics never mention.
For the projection numbers themselves, pair the exercise with an IPCC sea-level figure or your national survey's scenario page. The 3D model supplies the geography; the report supplies the timelines.
Classroom workflow
One laptop and a projector is enough: flood in front of the room, let students call out locations to test, hover anywhere to read its exact elevation out loud. For homework, share links let each student hand in a flooded scene of their own choosing — every annotation travels inside the link, so their questions are attached to the map.
Try it while it's fresh
The whole tool runs in your browser — pick a region, shape the relief, export. No account, nothing to install.
Open the terrain app