Blog › Elevation Profiles for Hike Planning: Read the Climb Before You Hike It
Elevation Profiles for Hike Planning: Read the Climb Before You Hike It
Guidebooks describe hikes with adjectives. "Steady climb through forest, then open slopes." Your legs do not hike adjectives — they hike metres. An elevation profile converts the description into numbers: where the climbing concentrates, how long the descent runs, and whether that "gentle start" is actually 400 metres of stairs.
Two clicks
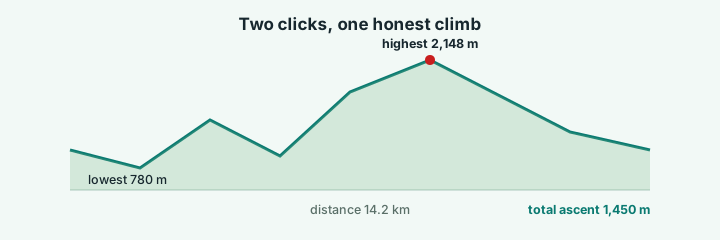
In the terrain app, switch on Measure profile and click two points on the map — trailhead and summit, or the gate and the lake. The chart appears immediately: elevation along the line between the points, with the four numbers that decide a hike called out — total distance, total ascent, the highest point and the lowest point. There is also an export button for the chart as a PNG, so the profile lands in your planning doc with nothing re-typed.
How to read it for planning
| What you see on the chart | What it means for the hike |
|---|---|
| One long ramp, no flats | A grind — check water stops and start early |
| Staircase: climb, dip, climb | Multiple summits; plan lunch at a dip |
| Wall at the start | The hardest part first — legs cold, arguments likely |
| Long gentle descent | Knees, not lungs — trekking poles earn their weight |
| Flat tail after a summit | Scenic exit walk; great for photos you forgot on the way up |
The four headline numbers map directly onto decisions. Total ascent is the honest fitness metric — 1,450 metres of ascent is a serious day regardless of distance. Total distance against ascent gives the steepness ratio. Highest point flags altitude concerns and weather exposure. Lowest point tells you where the river crossing sits.
Pair the chart with the terrain it came from
The profile is only half the picture — the other half is the terrain it was measured on. Because the chart comes from the same elevation grid as the map, you can click the profile's start and end points, then rotate the 3D model to see the spur you would walk and the valley you would skip. The steep section on the chart should match the gully on the relief; if it does not, you clicked across a valley instead of along the ridge.
If your route is already recorded — a GPX from a previous hike or a plan exported from Komoot — import it instead and the line drapes over the terrain; you still get the chart when you need it, drawn through your actual waypoints.
For the club chat
The exported profile PNG carries the chart alone; the full scene export carries title, legend, scale bar and credits. A practical combo for a club write-up: the 3D view as the hero image, the profile underneath it, and three numbers in the caption — distance, ascent, highest point. Anyone who has hiked will recognise the shape before reading a word.
An honest boundary
The profile follows the straight line between your two points — it does not follow switchbacks or detour around cliffs. For a ridge walk that is exactly what you want: the line the terrain allows. For a serpentine trail, import the GPX and read its profile instead. The tool gives you both, and the difference between them is itself useful: a straight-line profile steeper than the trail profile is a map of the switchbacks you will be grateful for.
Try it while it's fresh
The whole tool runs in your browser — pick a region, shape the relief, export. No account, nothing to install.
Open the terrain app