Blog › Contour Lines on Demand: How They're Drawn and Which Interval to Pick
Contour Lines on Demand: How They're Drawn and Which Interval to Pick
A contour line is a promise: everything touching this line stands at exactly the same elevation. Follow one with your eye and it either closes on itself around a hill or doubles back along a valley — and where lines crowd together, the ground between them is steep enough to matter. No other map element says steepness this economically.
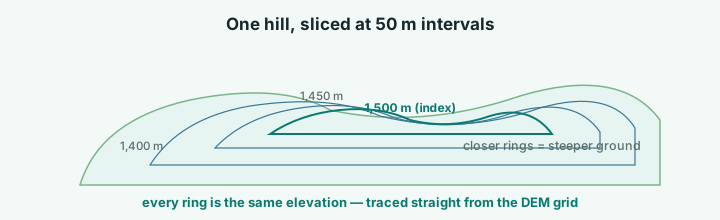
Where the lines come from
In the terrain app, contours are not a downloaded layer — they are computed from the same elevation grid the hillshade and the 3D model are built from. Tick Contours in the Layers panel and the renderer walks the elevation field, connecting every point that shares a height. That sourcing has two practical consequences:
- Contours agree with everything else on the map. The line, the shading, the 3D mesh and the hover readout are one dataset, so a ridge that looks steep is steep — by the same numbers.
- Contours follow your selection. A tight county view produces lines around local hills; a country view simplifies to the major form lines, because the interval has to mean something at that scale.
Choosing the interval
The interval is the height gap between neighbouring lines, and it is the one decision that changes everything. Pick too fine an interval on mountain terrain and the map turns into an unreadable hairball; pick too coarse one on gentle ground and you get a single lonely line crossing an empty plain.
| Terrain | Interval | What you get |
|---|---|---|
| Flat farmland or coastal plain | 25 m | Enough rings to show even 10-metre rises |
| Rolling hills | 50 m | The everyday default — clear and calm |
| Uplands and low mountains | 100 m | Form lines without clutter |
| High alpine terrain | 250 m | Only the major steps survive |
| Whole mountain ranges | 500 m | The big structure: massifs, escarpments, plateaus |
The app exposes exactly those steps — 25, 50, 100, 250 and 500 m — so the map stays legible at every scale. One habit worth stealing from paper maps: when the interval is small, keep an eye on the index contour (the heavier line drawn every fifth ring). Read only index contours and you get the shape; read the thin ones and you get the detail.
Reading steepness in two seconds
The interval turns steepness into counting. If crossing one line takes ten strides, the ground climbed the interval in ten strides. Two lines between those same strides: twice as steep. That is the whole skill — which is why contour-based route planning beats elevation profiles for spotting the one brutal climb everyone remembers.
For the quantitative version, switch on the app's elevation profile between two points: total distance, total ascent and the high and low points, charted along your line. Contours show where the climbing concentrates; the profile tells you how much.
Contours plus everything else
Because the lines are computed from the same grid, they stack cleanly with the rest of the layers: slope shading colours the surface by gradient (a fast way to spot the 30°+ faces skiers care about), water and buildings sit on top, and the whole stack exports into the PNG, the poster or the 3D print with the legend attached. A contour map that used to need a GIS project is now one toggle and one interval dropdown away.
Try it while it's fresh
The whole tool runs in your browser — pick a region, shape the relief, export. No account, nothing to install.
Open the terrain app